It’s a new quarter. And if you’re like most leaders, you may already be asking…
Why Create a Business Intelligence Web-Based Dashboard?
 For years your company has been reaping the advantages of computer automation to increase efficiency and collect and store data. Chances are, you have accumulated production data, customer data, and sales data and leads, inventory turns and various metrics. Now, the question is – what should you be doing with all that data?
The continual stream of data in your database can help you track, improve, strategize, and elevate your company’s progress and level of service. If this highly useful information is not being used to measure performance, you are missing out on a goldmine of information. We’ve all heard the saying, “What gets measured, gets done.”
Without your key performance indicators (KPI) readily available and in a digestible format, you’re moving forward blindly.
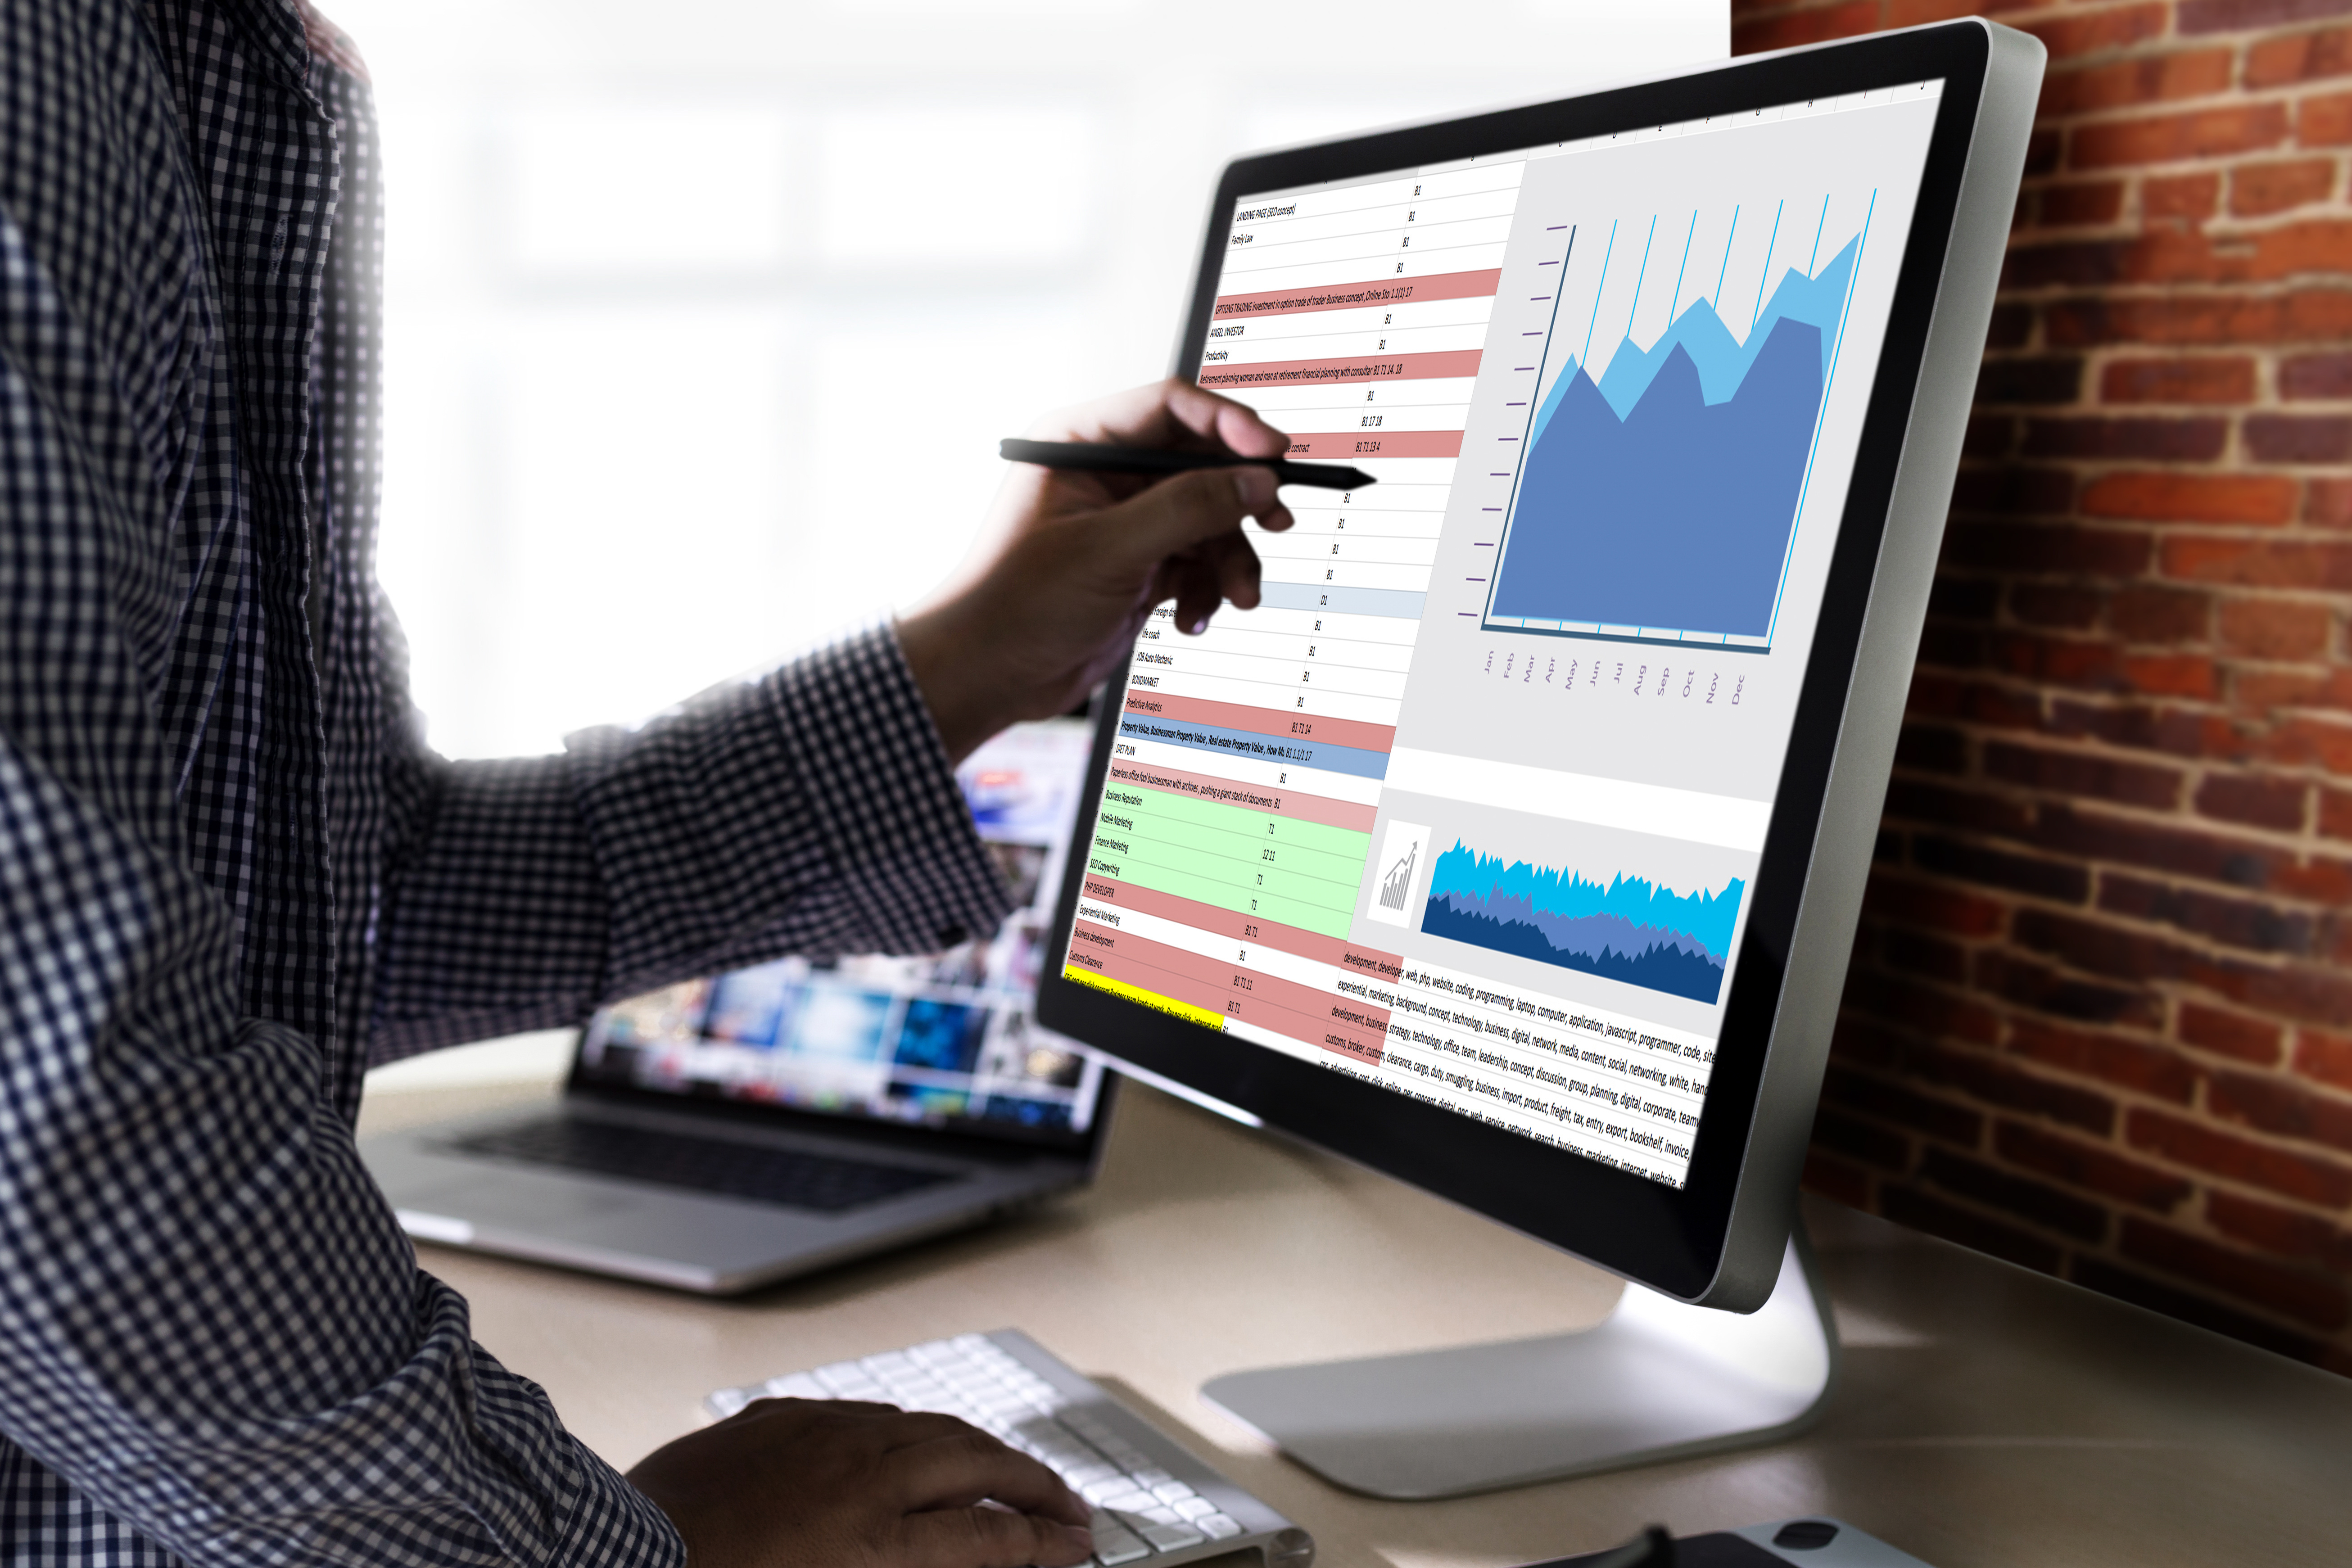
It may seem overwhelming to harness and harvest your data, but there is an easy automated solution. It’s called a business intelligence web-based dashboard and it can be customized and organized to provide minute-by-minute, hourly, daily, weekly, or monthly metrics at a glance – whatever you need to be in a constant state of efficiency and growth. It has never been more convenient to visualize and report KPIs.
Industry 4.0
Let’s take a step back and talk about Industry 4.0 – the next industrial revolution. It merges intuitive automation, digitizing, and data exchange in any type of business, including manufacturing, retail, and service-based companies, like IT and insurance. Cyber-physical systems, the Internet of things (IoT), cloud computing, AI, robotics process automation (RPA), and cognitive computing take Industry 3.0, the age of computer automation, to the next level.
These expanded technologies offer smart and autonomous systems powered by data and machine learning. This results in ultimate data accessibility, which maximizes efficiency with less waste. Funneling the data from all systems into organized dashboards identifies opportunities and optimizes logistics, supply chains, inventory, productivity metrics, order throughput, inbound leads, revenue, wages, billable percentages, customer data – the list is endless.

Robotics Process Automation or “RPA”
The Industry 4.0 revolution has us moving from Business Process Automation (BPA) to Robotics Process Automation (RPA). RPA may sound as if human-like robots are walking around doing human jobs, but in fact, RPA is smarter software, artificial intelligence (AI), and bot workers that generate intricate operations details in the form of data.
RPA allows employees to configure computer software, or “robotics,” to capture and interpret existing applications for transaction processing, data manipulation, and digital systems communication. For example, RPA lets you go from the manual key entry of a product’s details to barcoding the information, scanning the item, and automatically feeding the data onto a dashboard.
In an office with a busy fax machine? Faxes can be automated with digital readers. Fax data can be digitized and categorized onto a dashboard, and without any human interaction, result in instant information at your fingertips. Data doesn’t mean much if it can’t be automated, read, and acted upon. No matter your business, capturing data and organizing it onto a dashboard simplifies the visualization of KPIs, leading to more efficient growth.

OEE – An Example of Data-Driven Efficiencies
Overall Equipment Effectiveness, or OEE, is a measurement of productivity and a manufacturing best practice. It is the single best metric for identifying the percentage of manufacturing time that is completely productive. It identifies losses, sets standards, eliminates equipment and production waste, and creates data for constant improvements.
Using automated dashboards to organize, analyze, and measure OEE factors such as fully productive time to quality loss, net runtime to performance loss, runtime to availability loss, planned production time to schedule loss, and all-time metrics, you can speed up efficiencies to reach your OEE goal of 100%. Being able to read, interpret, and act upon the data is critical to strategy and productivity.
With an automated, customized dashboard to harvest data from your database, track, analyze, and improve systems, you can operate from a less reactive to a more predictive strategy and have such precise metrics, nothing will be left to chance.
The Bottom Line
Data dashboards are currently the most powerful tool for any business to track, monitor, and manage their most important metrics and KPIs. There is no better way to gather complex information from your existing database, present it in a clear, comprehensible way, and go forward to continuously improve efficiencies with total accuracy.
If you have any questions about dashboards or this article, the Swip Systems team is here to be a resource for you; we love to help in any way we can. Please don’t hesitate to reach out. 877.377.SWIP
Contact Us to Learn More
Related Posts